
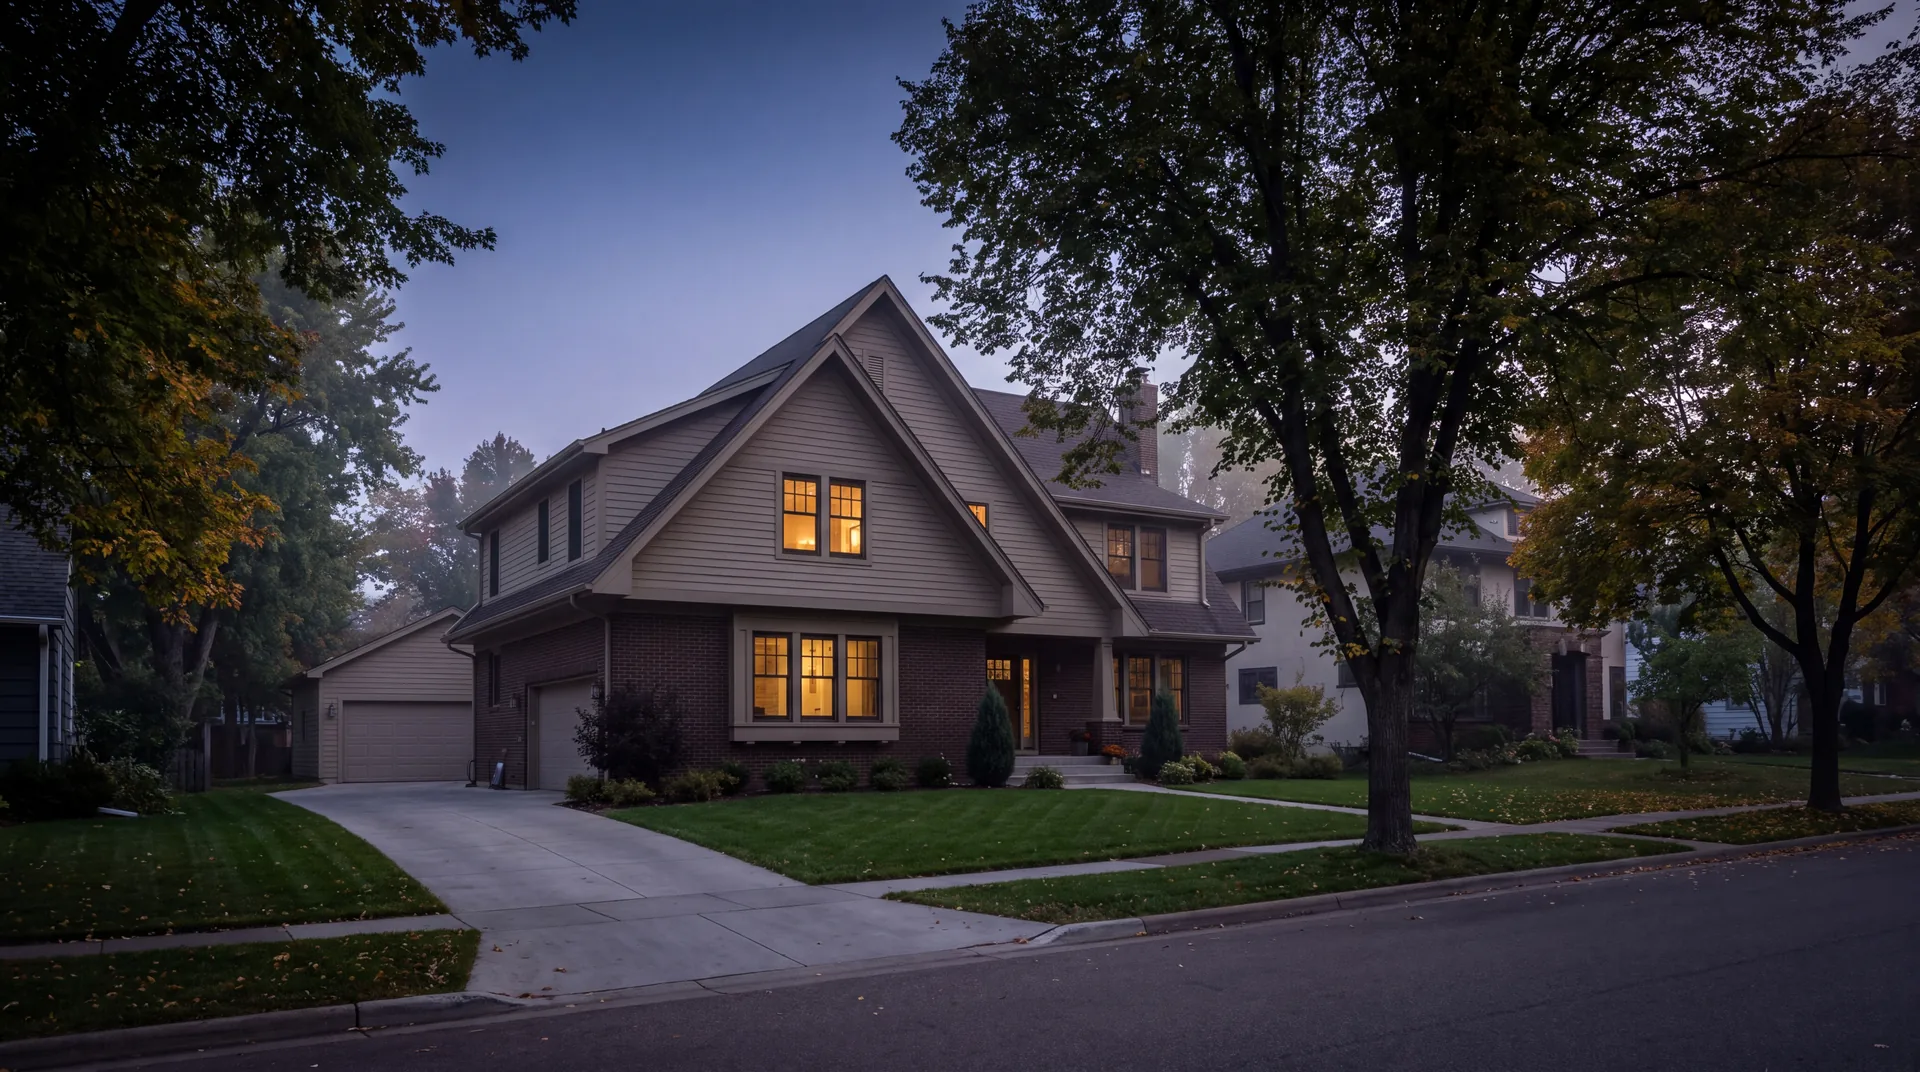
Doubling summer pacing on a 4BR home in the Minneapolis metro.
Representative image, generated for illustration. Properties are not identified.
Owner
Cecilia
Tenure
8.2 mo
Onboarded
Aug 2025
Period
Jun to Aug 2026 (OTB pacing)
vs. STLY
+101.3%
+$9,356
MPI
1.29x
vs. 34% mkt occ
OTB Revenue
$18,593
STLY: $9,237
ADR
$465
STLY: $342 (+36.0%)
June to August 2026 booked pacing versus the same point in 2025, not earned revenue. Full method.
The two-cycle repositioning
Most pricing wins look like a single inflection point. This one is two.
This 4-bedroom home in Hopkins, Minnesota has seen its average daily rate climb from $277 in 2025 final to $342 same-time-last-year to $465 on-the-books for summer 2026, a +68% lift over 24 months, layered on top of a +101.3% summer pacing lift vs. STLY. The Market Penetration Index sits at 1.29x for the summer in aggregate and 1.89x in August specifically. When the broader Minneapolis-metro market softens into late summer, this property does not.
This is what slow-and-steady positioning looks like when the math compounds. Each cycle the rate moves up, the comp set moves to support it, and the calendar fills earlier in the booking window.
The Minneapolis-metro context
Hopkins sits inside RevFactor’s 5-property Minneapolis-metro concentration, including this owner’s second property, a 3-bedroom Minneapolis listing also under RevFactor management, which ran +152.9% in Q1 2026. That dual-property visibility lets the team triangulate market behavior across two property types in the same submarket.
The market itself is a steady-state environment: 33.8% summer market occupancy, no extreme peaks, no extreme troughs. That is the kind of market where revenue management quietly wins. You do not ride a peak here. You capture 30% to 50% more share in the months when most operators are coasting.
What changed
Without disclosing owner-specific configuration, the visible pattern in the calendar:
- Rate ladder, two steps up. ADR moved up $65 from 2024 to 2025, then another $123 from 2025 STLY to 2026 OTB. That is the comp set being moved up under the listing, one step at a time, rather than a single price increase.
- Off-peak share capture. August’s 1.89x MPI is a clue: the property is getting roughly twice the share its market position would suggest in the market’s softest month. That is a length-of-stay-discount and minimum-stay signal, capturing the 5+ night bookings comp-set restrictions filter out.
- Pacing discipline. OTB occupancy is 43.5% with months of booking window left. That is a calendar that locked in early at premium, not one that filled late at discount.
Comp window detail
| Window | OTB Rev | STLY Rev | $ Lift | OTB Occ | OTB ADR | MPI |
|---|---|---|---|---|---|---|
| June 2026 | $5,220 | $3,626 | +$1,594 | 36.7% | $474 | 0.90x |
| July 2026 | $8,350 | $4,349 | +$4,001 | 54.8% | $491 | 1.36x |
| August 2026 | $5,023 | $1,262 | +$3,761 | 38.7% | $419 | 1.89x |
| Summer total | $18,593 | $9,237 | +$9,356 | 43.5% | $465 | 1.29x |
What it costs
RevFactor manages this property at a flat $350 per month, plus a one-time $150 onboarding fee. The +$9,356 in on-the-books summer lift covers the onboarding fee and about 26 months (just over two years) of management fees. And that is pacing data alone, before the rest of the booking window closes.
A note on these numbers
OTB = on-the-books revenue committed as of the May 2026 data pull. STLY = same-time-last-year. LY = final 2025 revenue for the June to August window. These are booked pacing figures, not earned revenue, and this page will be updated to earned results once the summer closes. Past performance is not indicative of future results.
Method
Figures on this page are booked pacing (on-the-books revenue as of the May 2026 data pull) versus the same point in 2025, not earned revenue. They will be updated to earned results once the summer closes. The property is identified by size and market, and the owner by first name only. The photograph above is representative of the property type and region and does not depict this listing.
How this was measured
Property: 4-bedroom in Hopkins, MN (Minneapolis Metro, MN). Onboarded: August 2025, 8.2 months of tenure at measurement. Window: June to August 2026 booked pacing (on-the-books revenue as of the May 2026 data pull) against the same point in the 2025 booking curve.
- OTB (on-the-books):
- revenue already committed via confirmed bookings for the window, as of the pull date.
- STLY (same-time-last-year):
- what the calendar held a year earlier for the same future window.
- LY (last-year final):
- final realized revenue for the same window in 2025.
- MPI (Market Penetration Index):
- the property's booked share divided by its fair share of the comp set. 1.00x paces the market; above 1.00x leads it.
- ADR (average daily rate):
- average price of booked nights.
- Occupancy:
- booked nights divided by available nights. "Mkt occ" is the comp set's average for the same window.
Cost: flat $350 per month plus a one-time $150 onboarding fee, no percent of revenue. The booked lift shown above covers the onboarding fee and about 26 months of management fees.
YOUR NUMBERS, NEXT
What would your comp-set look like after a strategy call?
A 30-minute strategy call. We pull your comp-set, walk through where pacing is leaving money, and tell you whether RevFactor is the right fit. No pitch deck.
Book a strategy call →