
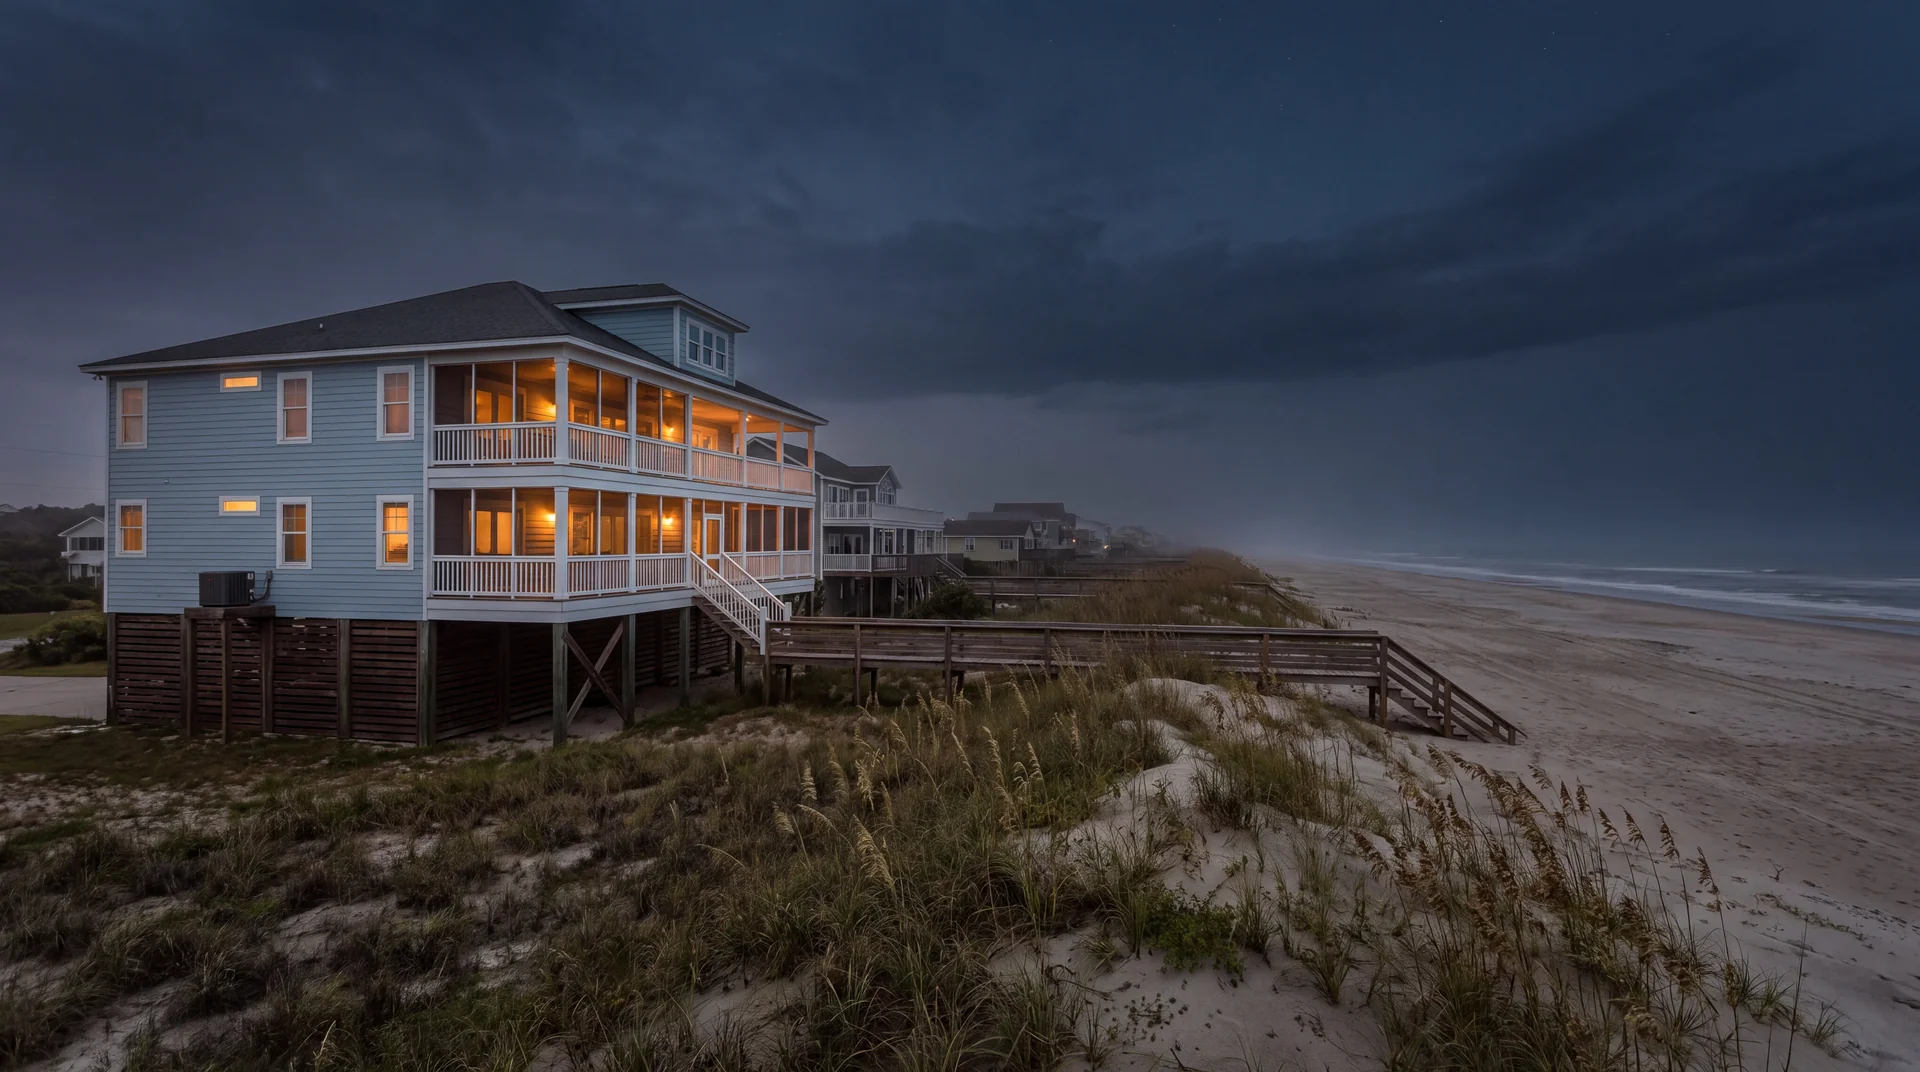
Doubling pacing in a 51%-occupancy beach market: a 5BR home in North Myrtle Beach.
Representative image, generated for illustration. Properties are not identified.
Owner
Elizabeth
Tenure
7.1 mo
Onboarded
Oct 2025
Period
Jun to Aug 2026 (OTB pacing)
vs. STLY
+106.4%
+$21,353
MPI
1.11x
vs. 51% mkt occ
OTB Revenue
$41,418
STLY: $20,065
ADR
$797
STLY: $692 (+15.2%)
June to August 2026 booked pacing versus the same point in 2025, not earned revenue. Full method.
The dense-market story
North Myrtle Beach is the second-largest concentration of properties in RevFactor’s portfolio: 14 active listings. That matters for a reason that is easy to miss. The comp set is not a guess. RevFactor’s team can see, in real time, what 14 different positioning experiments in the same submarket are doing, then apply that learning across the rest of the portfolio.
This 5-bedroom home is pacing +106.4% ahead of where it was at this point last year (+$21,352 in on-the-books summer revenue). Its Market Penetration Index sits at 1.11x, modestly ahead of the broader 51% market-occupancy environment. The more interesting number is July at 1.23x. That is the month where the market peaks and where positioning becomes hardest. The property is leading the market when the market itself is at its best.
Why this market is harder than it looks
A 51% market occupancy in summer is the inverse of a tertiary lake market. Demand is real, but so is supply. Every weekend has 100+ listings competing on identical search criteria: five bedrooms, beach proximity, hot tub, dog-friendly. The differentiation that wins is positioning, not volume.
The visible signal in the calendar suggests the property is winning on rate compression and timing. ADR has climbed across three years: $589 final 2025 to $692 STLY to $797 OTB, a +35% climb over two cycles. That is a property whose comp-set position has been moved up the rate ladder one step at a time, while the algorithm and minimum-stay strategy have been tuned to keep occupancy from cracking.
What changed in the first 7 months
Without disclosing owner-specific configuration, the public pattern is consistent with three plays Federico Zimerman has discussed in interviews:
- Market-aware shoulder-season pricing. June OTB occupancy is 53% vs. 32% same-time-last-year, so the team booked the calendar early at premium rather than waiting for last-minute walk-ups.
- Length-of-stay discount layering. When the market average is 4 to 5 nights and your property captures a 7-night booking on a 10% LOS discount, your effective ADR holds while occupancy climbs.
- Channel mix discipline. A dense Airbnb market also means a thicker VRBO and Booking.com market, and the algorithm does not consider all of it equally. Hand-tuning channel-specific pricing rules is the kind of work pure tools do not do.
Comp window detail
| Window | OTB Rev | STLY Rev | $ Lift | OTB Occ | OTB ADR | MPI |
|---|---|---|---|---|---|---|
| June 2026 | $12,497 | $6,146 | +$6,351 | 53.3% | $781 | 0.85x |
| July 2026 | $20,100 | $4,347 | +$15,753 | 74.2% | $874 | 1.23x |
| August 2026 | $8,821 | $9,572 | −$751 | 41.9% | $678 | 1.38x |
| Summer total | $41,418 | $20,065 | +$21,352 | 56.5% | $797 | 1.11x |
The August dip vs. STLY is the kind of nuance that gets flattened in a single-number headline. Rates are holding ($678 OTB vs. $638 STLY), but absolute revenue ticked slightly down because the 2025 calendar had captured a few high-night-count bookings already. With four months of booking window left, this is the metric the team will be working hardest on.
What it costs
RevFactor manages this property at a flat $350 per month, plus a one-time $150 onboarding fee. The +$21,352 in on-the-books summer lift covers the onboarding fee and about 60 months (five years) of management fees on this listing alone.
A note on these numbers
OTB = on-the-books revenue committed as of the May 2026 data pull. STLY = same-time-last-year (same booking-curve point in 2025). LY = final 2025 revenue for the June to August window. These are booked pacing figures, not earned revenue, and this page will be updated to earned results once the summer closes. Past performance is not indicative of future results.
Method
Figures on this page are booked pacing (on-the-books revenue as of the May 2026 data pull) versus the same point in 2025, not earned revenue. They will be updated to earned results once the summer closes. The property is identified by size and market, and the owner by first name only. The photograph above is representative of the property type and region and does not depict this listing.
How this was measured
Property: 5-bedroom in North Myrtle Beach, SC. Onboarded: October 2025, 7.1 months of tenure at measurement. Window: June to August 2026 booked pacing (on-the-books revenue as of the May 2026 data pull) against the same point in the 2025 booking curve.
- OTB (on-the-books):
- revenue already committed via confirmed bookings for the window, as of the pull date.
- STLY (same-time-last-year):
- what the calendar held a year earlier for the same future window.
- LY (last-year final):
- final realized revenue for the same window in 2025.
- MPI (Market Penetration Index):
- the property's booked share divided by its fair share of the comp set. 1.00x paces the market; above 1.00x leads it.
- ADR (average daily rate):
- average price of booked nights.
- Occupancy:
- booked nights divided by available nights. "Mkt occ" is the comp set's average for the same window.
Cost: flat $350 per month plus a one-time $150 onboarding fee, no percent of revenue. The booked lift shown above covers the onboarding fee and about 60 months of management fees.
YOUR NUMBERS, NEXT
What would your comp-set look like after a strategy call?
A 30-minute strategy call. We pull your comp-set, walk through where pacing is leaving money, and tell you whether RevFactor is the right fit. No pitch deck.
Book a strategy call →